8 Parameterized COVID-19 report
In this chapter I will focus on parameters, the next step and an important part when it comes to a reproducible analysis. The benefit of using parameters is it’ll help simplify re-using or applying the analysis to different datasets or various categories within the same dataset. I will use COVID-19 data (2022) and use COVID19 cases and COVID19-related deaths. The aim is is to create a parameterized report for the COVID-19 cases and deaths and visualize them in plots.
Firstly, the analysis will be executed with three parameters: The country to which the report applies to, the year that the reported data applies to and the period in months that the report applies to.
8.1 Inspecting the data
The first step in the parameters (and in any data analysis, really) is to inspect the data.
library(tidyverse)
library(readxl)
library(readr)
library(here)
library(tibble)
library(reactable)
library(plotly)
library(ggplot2)
library(dplyr)

covid19_data <- read.csv(here::here ("data.csv"))

# Types of variables in de COVID-dataset
str(covid19_data) # There are 11 variables in total
## 'data.frame': 28729 obs. of 11 variables:
## $ dateRep : chr "23/10/2022" "22/10/2022" "21/10/2022" "20/10/2022" ...
## $ day : int 23 22 21 20 19 18 17 16 15 14 ...
## $ month : int 10 10 10 10 10 10 10 10 10 10 ...
## $ year : int 2022 2022 2022 2022 2022 2022 2022 2022 2022 2022 ...
## $ cases : int 3557 5494 7776 8221 10007 13204 9964 6606 8818 11751 ...
## $ deaths : int 0 4 4 6 8 7 8 12 6 10 ...
## $ countriesAndTerritories: chr "Austria" "Austria" "Austria" "Austria" ...
## $ geoId : chr "AT" "AT" "AT" "AT" ...
## $ countryterritoryCode : chr "AUT" "AUT" "AUT" "AUT" ...
## $ popData2020 : int 8901064 8901064 8901064 8901064 8901064 8901064 8901064 8901064 8901064 8901064 ...
## $ continentExp : chr "Europe" "Europe" "Europe" "Europe" ...# Define the parameters in an object
params <- list(country = "Netherlands",
fromMonth = 4,
untilMonth = 7,
year = 2020)
# Selecting the three parameters
covid19_data_parameters <- covid19_data %>% filter(countriesAndTerritories == params$country,
year == params$year,
month == c(params$fromMonth:params$untilMonth))
# Checking data types of each variable
covid19_data_parameters %>% map(class) ## $dateRep
## [1] "character"
##
## $day
## [1] "integer"
##
## $month
## [1] "integer"
##
## $year
## [1] "integer"
##
## $cases
## [1] "integer"
##
## $deaths
## [1] "integer"
##
## $countriesAndTerritories
## [1] "character"
##
## $geoId
## [1] "character"
##
## $countryterritoryCode
## [1] "character"
##
## $popData2020
## [1] "integer"
##
## $continentExp
## [1] "character"# Converting "dataRep" into class date and "geoID" into factor
covid19_data_parameters$geoId <- factor(covid19_data_parameters$geoId)
covid19_data_parameters$dateRep <- as.Date(covid19_data_parameters$dateRep, format = "%d/%m/%Y")
# Filter data for the months from April to July
covid19_filtered <- covid19_data_parameters %>%
filter(dateRep >= as.Date("2020-04-01") & dateRep <= as.Date("2020-07-31"))8.2 Visualising the data
# Create the plot
covid19_netherlands <- ggplot(covid19_filtered, aes(x = dateRep)) +
  geom_line(aes(y = cases, color = "Cases"), size = 1) +
  geom_line(aes(y = deaths, color = "Deaths"), size = 1) +
  labs(title = "COVID-19 Cases and Deaths from April to July 2020 in the Netherlands",
       x = "Date (months)",
       y = "Count",
       color = "Legend") +
  scale_color_manual(values = c("Cases" = "red", "Deaths" = "lightblue")) +
  theme_minimal() +
  theme(plot.title = element_text(hjust = 0.5),
        legend.position = "bottom")

plot_netherlands <- covid19_netherlands %>% ggplotly()
plot_netherlands
Figure 8.1: The COVID-19 cases and deaths from April until July in Netherlands in the year 2020.
8.3 Parameters
The plot in figure 8.2 was made by using parameters. We can now change these parameters to display different data. For example, let’s say we’re interested in the COVID-19 related deaths and cases in another country in a certain period of time. Let’s take Ireland from April to July in 2020.
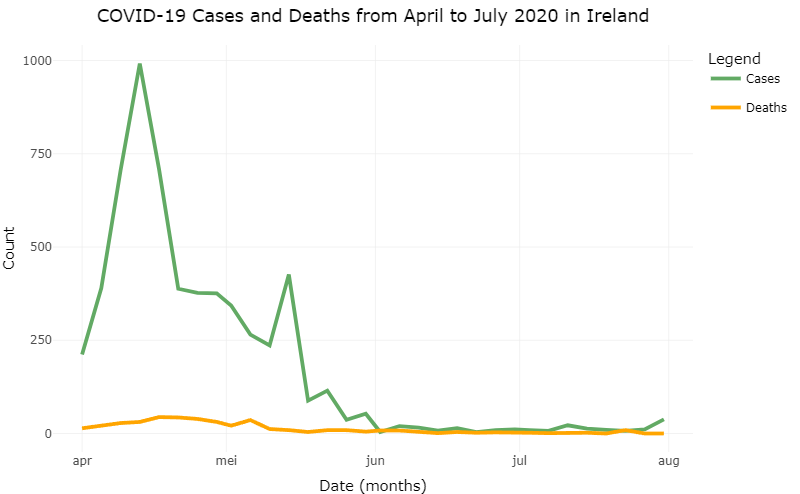
Figure 8.2: COVID-19 related cases and deaths in Sweden from May ’til August in 2020 after changing the parameters.
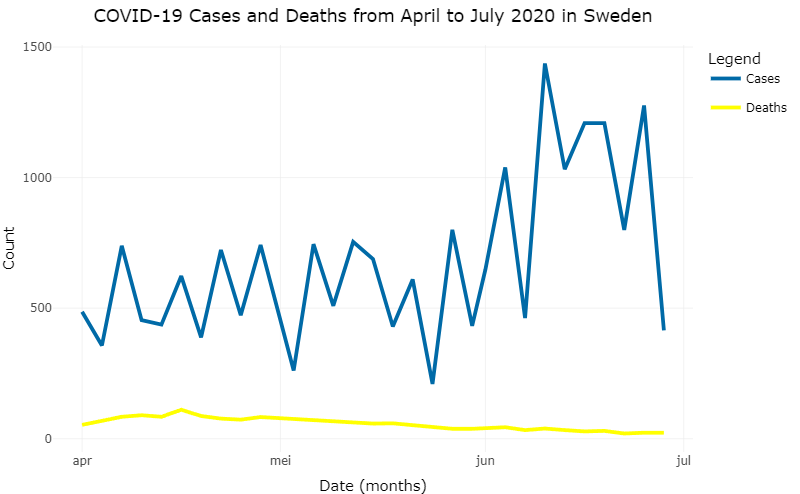
Figure 8.3: COVID-19 related cases and deaths in Sweden from May ’til August in 2020 after changing the parameters.